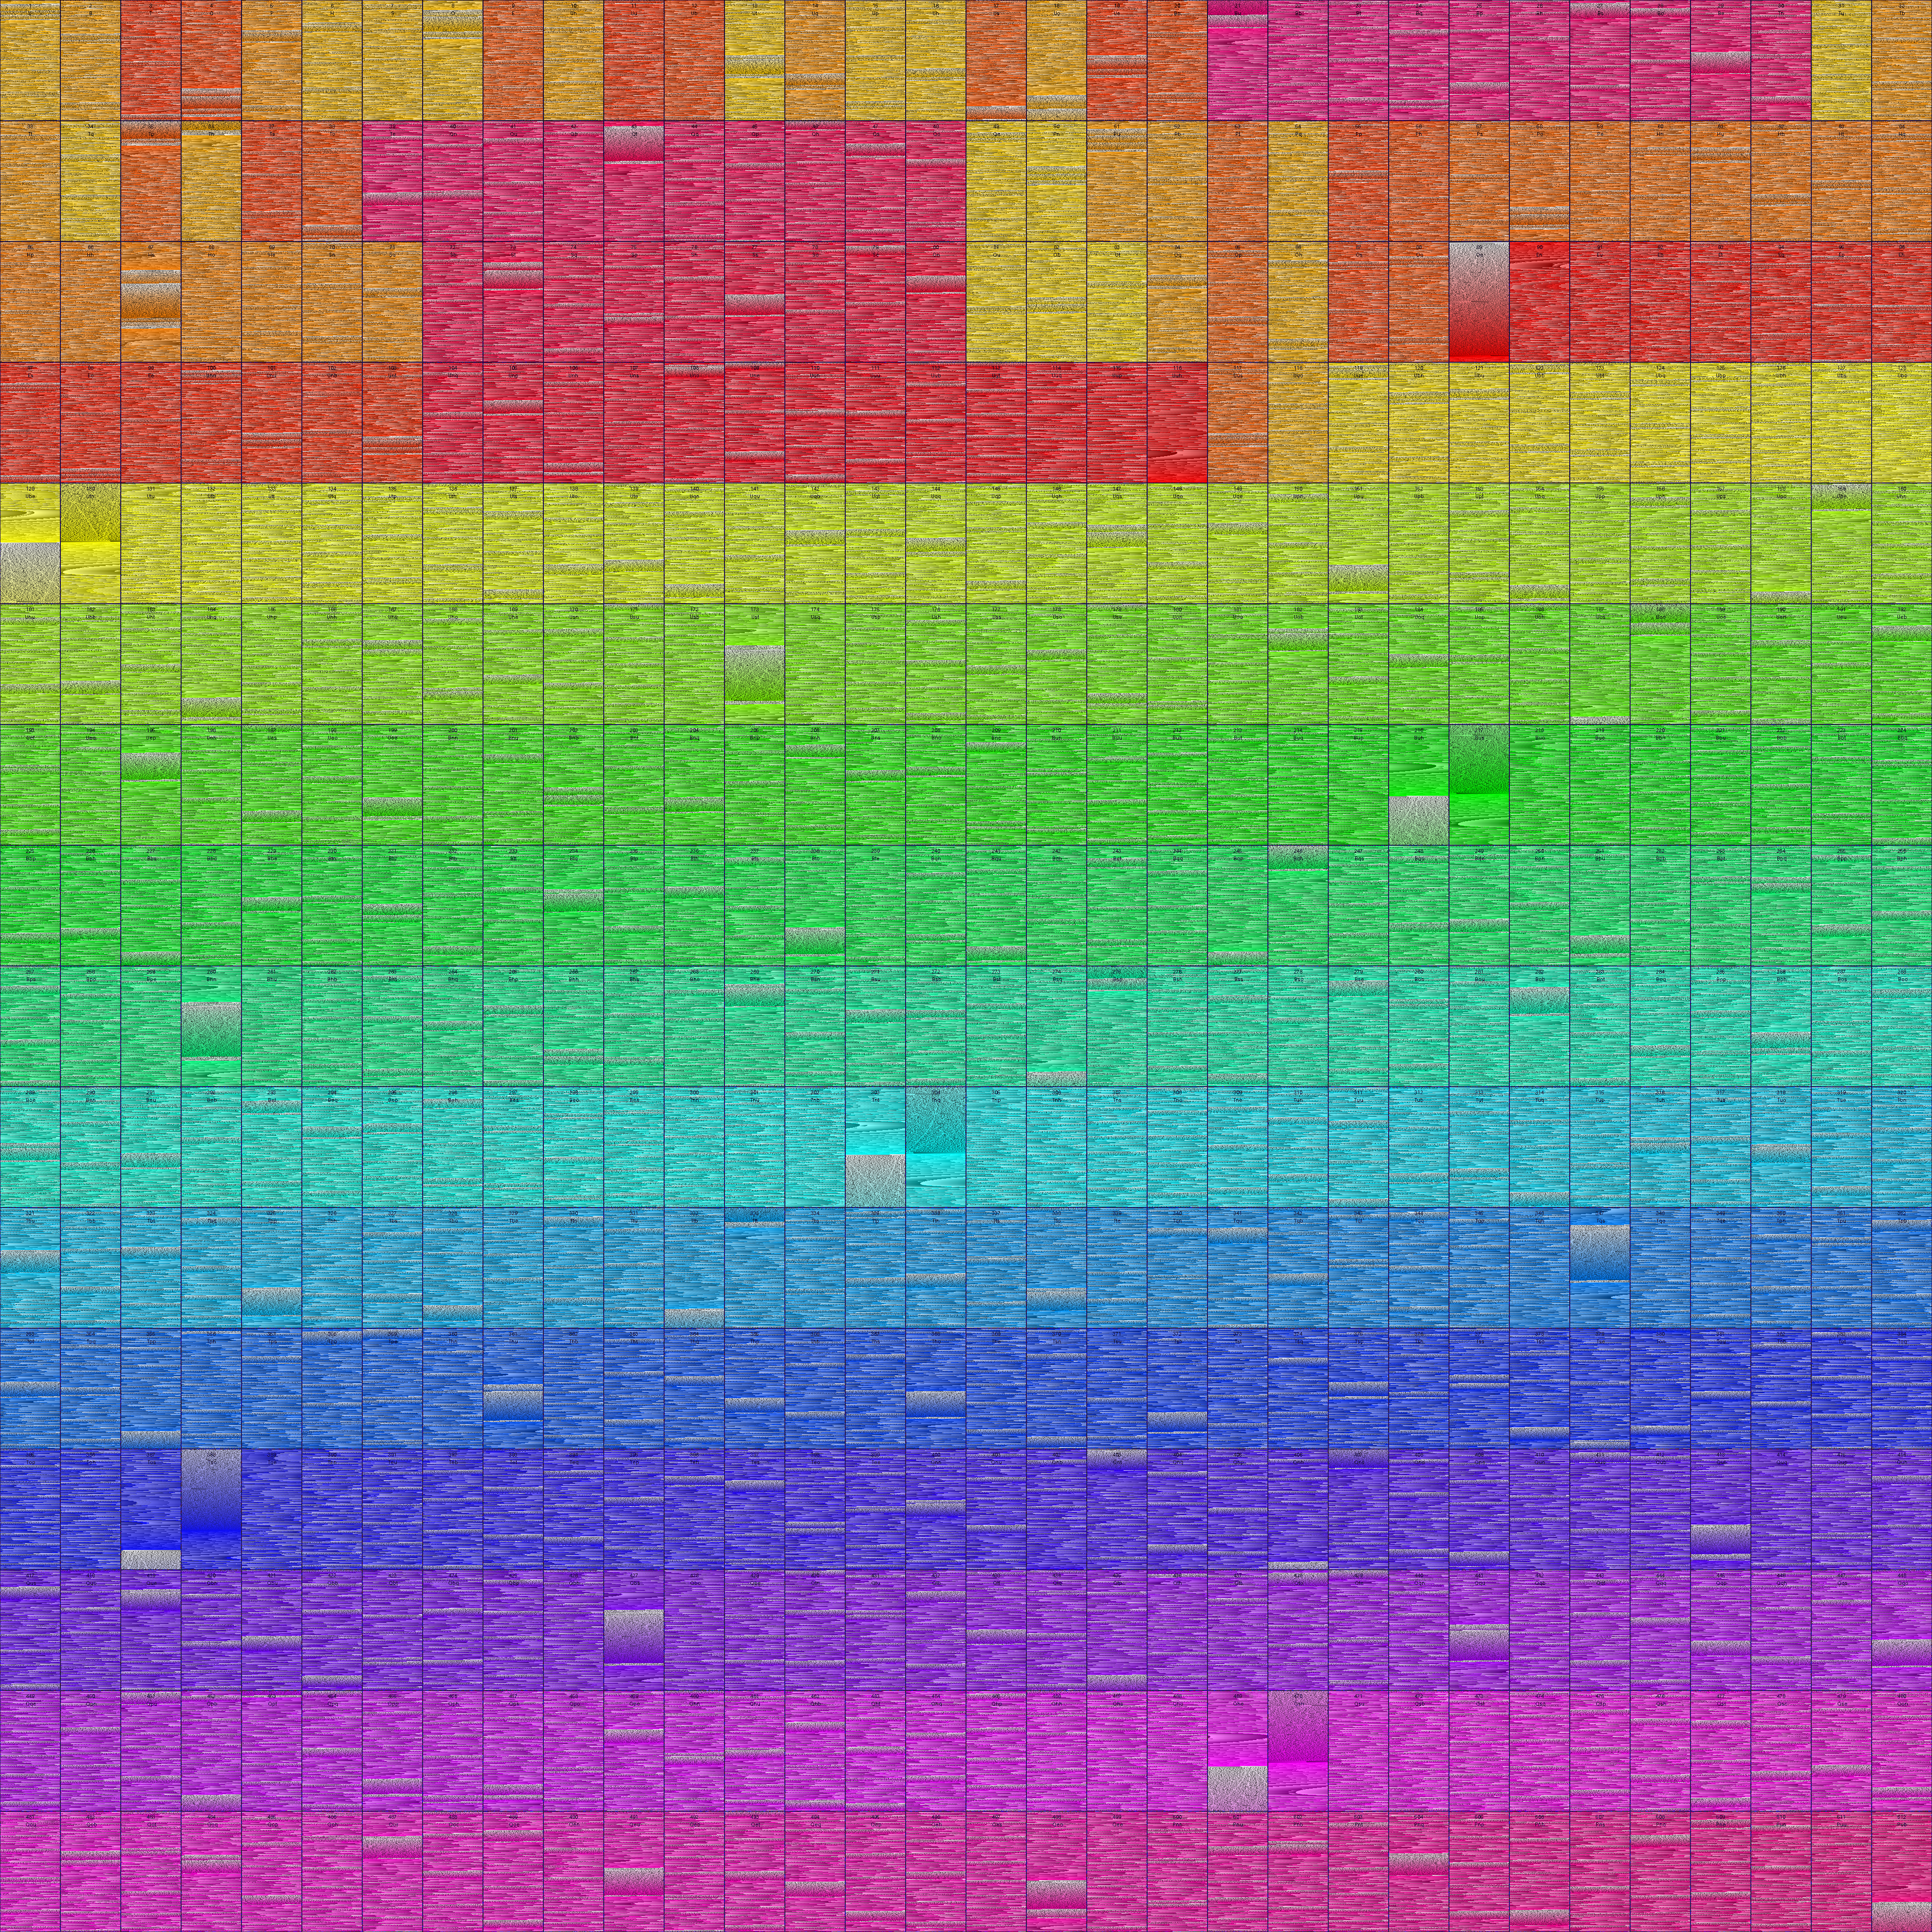
Another project of mine, called Periodic System, is an online and interactieve periodic table of the chemical elements that can be extended to arbitrary large (and small) elements on the fly.
I’ve always wanted to create an allrgb entry dedicated to it, but never got around to. So, as with many other unfinished projects these days, I asked Chatgpt to do it for me. It’s not as pretty as I’d like, but it’s technically correct, and like the meme states, that’s the best kind.
import numpy as np
from PIL import Image, ImageDraw, ImageFont
import colorsys
from collections import defaultdict

# === Constants ===
WIDTH, HEIGHT = 4096, 4096
TOTAL_COLORS = WIDTH * HEIGHT
ELEMENT_COUNT = 512
GRID_COLS = 32
CELL_W = WIDTH // GRID_COLS
CELL_H = HEIGHT // ((ELEMENT_COUNT + GRID_COLS - 1) // GRID_COLS)
TEXT_MARGIN = 4  # Increased margin for label padding

# === Generate and sort all RGB colors ===
colors = np.array([[r, g, b] for r in range(256)
                   for g in range(256)
                   for b in range(256)], dtype=np.uint8)

def rgb_to_hsb(c):
    r, g, b = [x / 255.0 for x in c]
    return colorsys.rgb_to_hsv(r, g, b)

colors_sorted_hsb = sorted(colors, key=rgb_to_hsb)
colors_sorted_brightness = sorted(colors, key=lambda rgb: 0.299 * rgb[0] + 0.587 * rgb[1] + 0.114 * rgb[2])

# === Font setup ===
try:
    font = ImageFont.truetype("PixelOperator8.ttf", 12)
except:
    font = ImageFont.load_default()

# === Symbol generator ===
def generate_element_symbol(n):
    roots = ['n', 'u', 'b', 't', 'q', 'p', 'h', 's', 'o', 'e']
    digits = list(map(int, str(n)))
    return ''.join(roots[d] for d in digits)[:3].capitalize()

# === Chemical classification ===
def classify_element(n):
    if n == 1: return "nonmetal"
    if n in [2, 10, 18, 36, 54, 86, 118]: return "noble_gas"
    if n in [5, 14, 32, 33, 51, 52, 84]: return "metalloid"
    if n in [9, 17, 35, 53, 85, 117]: return "halogen"
    if n in [6, 7, 8, 15, 16, 34]: return "nonmetal"
    if n in [3, 11, 19, 37, 55, 87]: return "alkali"
    if n in [4, 12, 20, 38, 56, 88]: return "alkaline"
    if 57 <= n <= 71: return "lanthanide"
    if 89 <= n <= 103: return "actinide"
    if 104 <= n <= 112 or (21 <= n <= 30) or (39 <= n <= 48) or (72 <= n <= 80): return "transition"
    if (13 <= n <= 16) or (31 <= n <= 34) or (49 <= n <= 52) or (81 <= n <= 84): return "post_transition"
    if n >= 119: return "superactinide"
    return "unknown"

element_categories = [classify_element(n) for n in range(1, ELEMENT_COUNT + 1)]
unique_categories = sorted(set(element_categories))
category_counts = {cat: element_categories.count(cat) for cat in unique_categories}

# === Reserve image canvas ===
image_array = np.zeros((HEIGHT, WIDTH, 3), dtype=np.uint8)
used_pixels = np.zeros((HEIGHT, WIDTH), dtype=bool)
text_coords, border_coords = [], []
element_by_category = defaultdict(list)

# === Step 1: Reserve text label coordinates ===
for n in range(1, ELEMENT_COUNT + 1):
    row, col = (n - 1) // GRID_COLS, (n - 1) % GRID_COLS
    x0, y0 = col * CELL_W, row * CELL_H
    symbol = generate_element_symbol(n)
    label = f"{n}\n{symbol}"
    y_cursor = y0 + 4
    element_by_category[classify_element(n)].append((n, x0, y0))

    for line in label.split('\n'):
        bbox = font.getbbox(line)
        x_min, y_min, x_max, y_max = bbox
        width = x_max - x_min + 2 * TEXT_MARGIN
        height = y_max - y_min + 2 * TEXT_MARGIN
        x_cursor = x0 + (CELL_W - width) // 2

        mask = Image.new("1", (width, height), 0)
        draw = ImageDraw.Draw(mask)
        draw.text((TEXT_MARGIN - x_min, TEXT_MARGIN - y_min), line, fill=1, font=font)
        mask_array = np.array(mask)

        for dy in range(height):
            for dx in range(width):
                if mask_array[dy, dx] == 1:
                    px, py = x_cursor + dx, y_cursor + dy
                    if 0 <= px < WIDTH and 0 <= py < HEIGHT:
                        text_coords.append((py, px))
                        used_pixels[py, px] = True

        y_cursor += height

# === Step 2: Reserve 1px cell borders ===
for n in range(1, ELEMENT_COUNT + 1):
    row, col = (n - 1) // GRID_COLS, (n - 1) % GRID_COLS
    x0, y0 = col * CELL_W, row * CELL_H
    x1, y1 = x0 + CELL_W, y0 + CELL_H

    for x in range(x0, x1):
        for y in (y0, y1 - 1):  # top and bottom
            if not used_pixels[y, x]:
                border_coords.append((y, x))
                used_pixels[y, x] = True
    for y in range(y0 + 1, y1 - 1):
        for x in (x0, x1 - 1):  # left and right
            if not used_pixels[y, x]:
                border_coords.append((y, x))
                used_pixels[y, x] = True

# === Step 3: Assign RGBs to text and borders ===
colors_for_text = colors_sorted_brightness[:len(text_coords)]
colors_for_border = colors_sorted_brightness[len(text_coords):len(text_coords) + len(border_coords)]

for i, (py, px) in enumerate(text_coords):
    image_array[py, px] = colors_for_text[i]
for i, (py, px) in enumerate(border_coords):
    image_array[py, px] = colors_for_border[i]

used_color_set = set(tuple(c) for c in colors_for_text + colors_for_border)

# === Step 4: Fill remaining cell pixels, clustered by series ===
remaining_colors = [tuple(c) for c in colors_sorted_hsb if tuple(c) not in used_color_set]
color_index = 0

for category in unique_categories:
    for n, x0, y0 in element_by_category[category]:
        for y in range(y0, y0 + CELL_H):
            for x in range(x0, x0 + CELL_W):
                if not used_pixels[y, x]:
                    image_array[y, x] = remaining_colors[color_index]
                    used_pixels[y, x] = True
                    color_index += 1

# === Final Validation ===
#assert np.count_nonzero(used_pixels) == TOTAL_COLORS, "❌ Pixel count mismatch"
#assert color_index + len(text_coords) + len(border_coords) == TOTAL_COLORS, "❌ Color count mismatch"
print(np.count_nonzero(used_pixels))
print(color_index + len(text_coords) + len(border_coords))

# === Save image ===
Image.fromarray(image_array, 'RGB').save("periodic_table_series_clustered.png")
print("✅ Saved as 'periodic_table_series_clustered.png'")
| Date | |
|---|---|
| Colors | 16,777,216 |
| Pixels | 16,777,216 |
| Dimensions | 4,096 × 4,096 |
| Bytes | 21,791,837 |