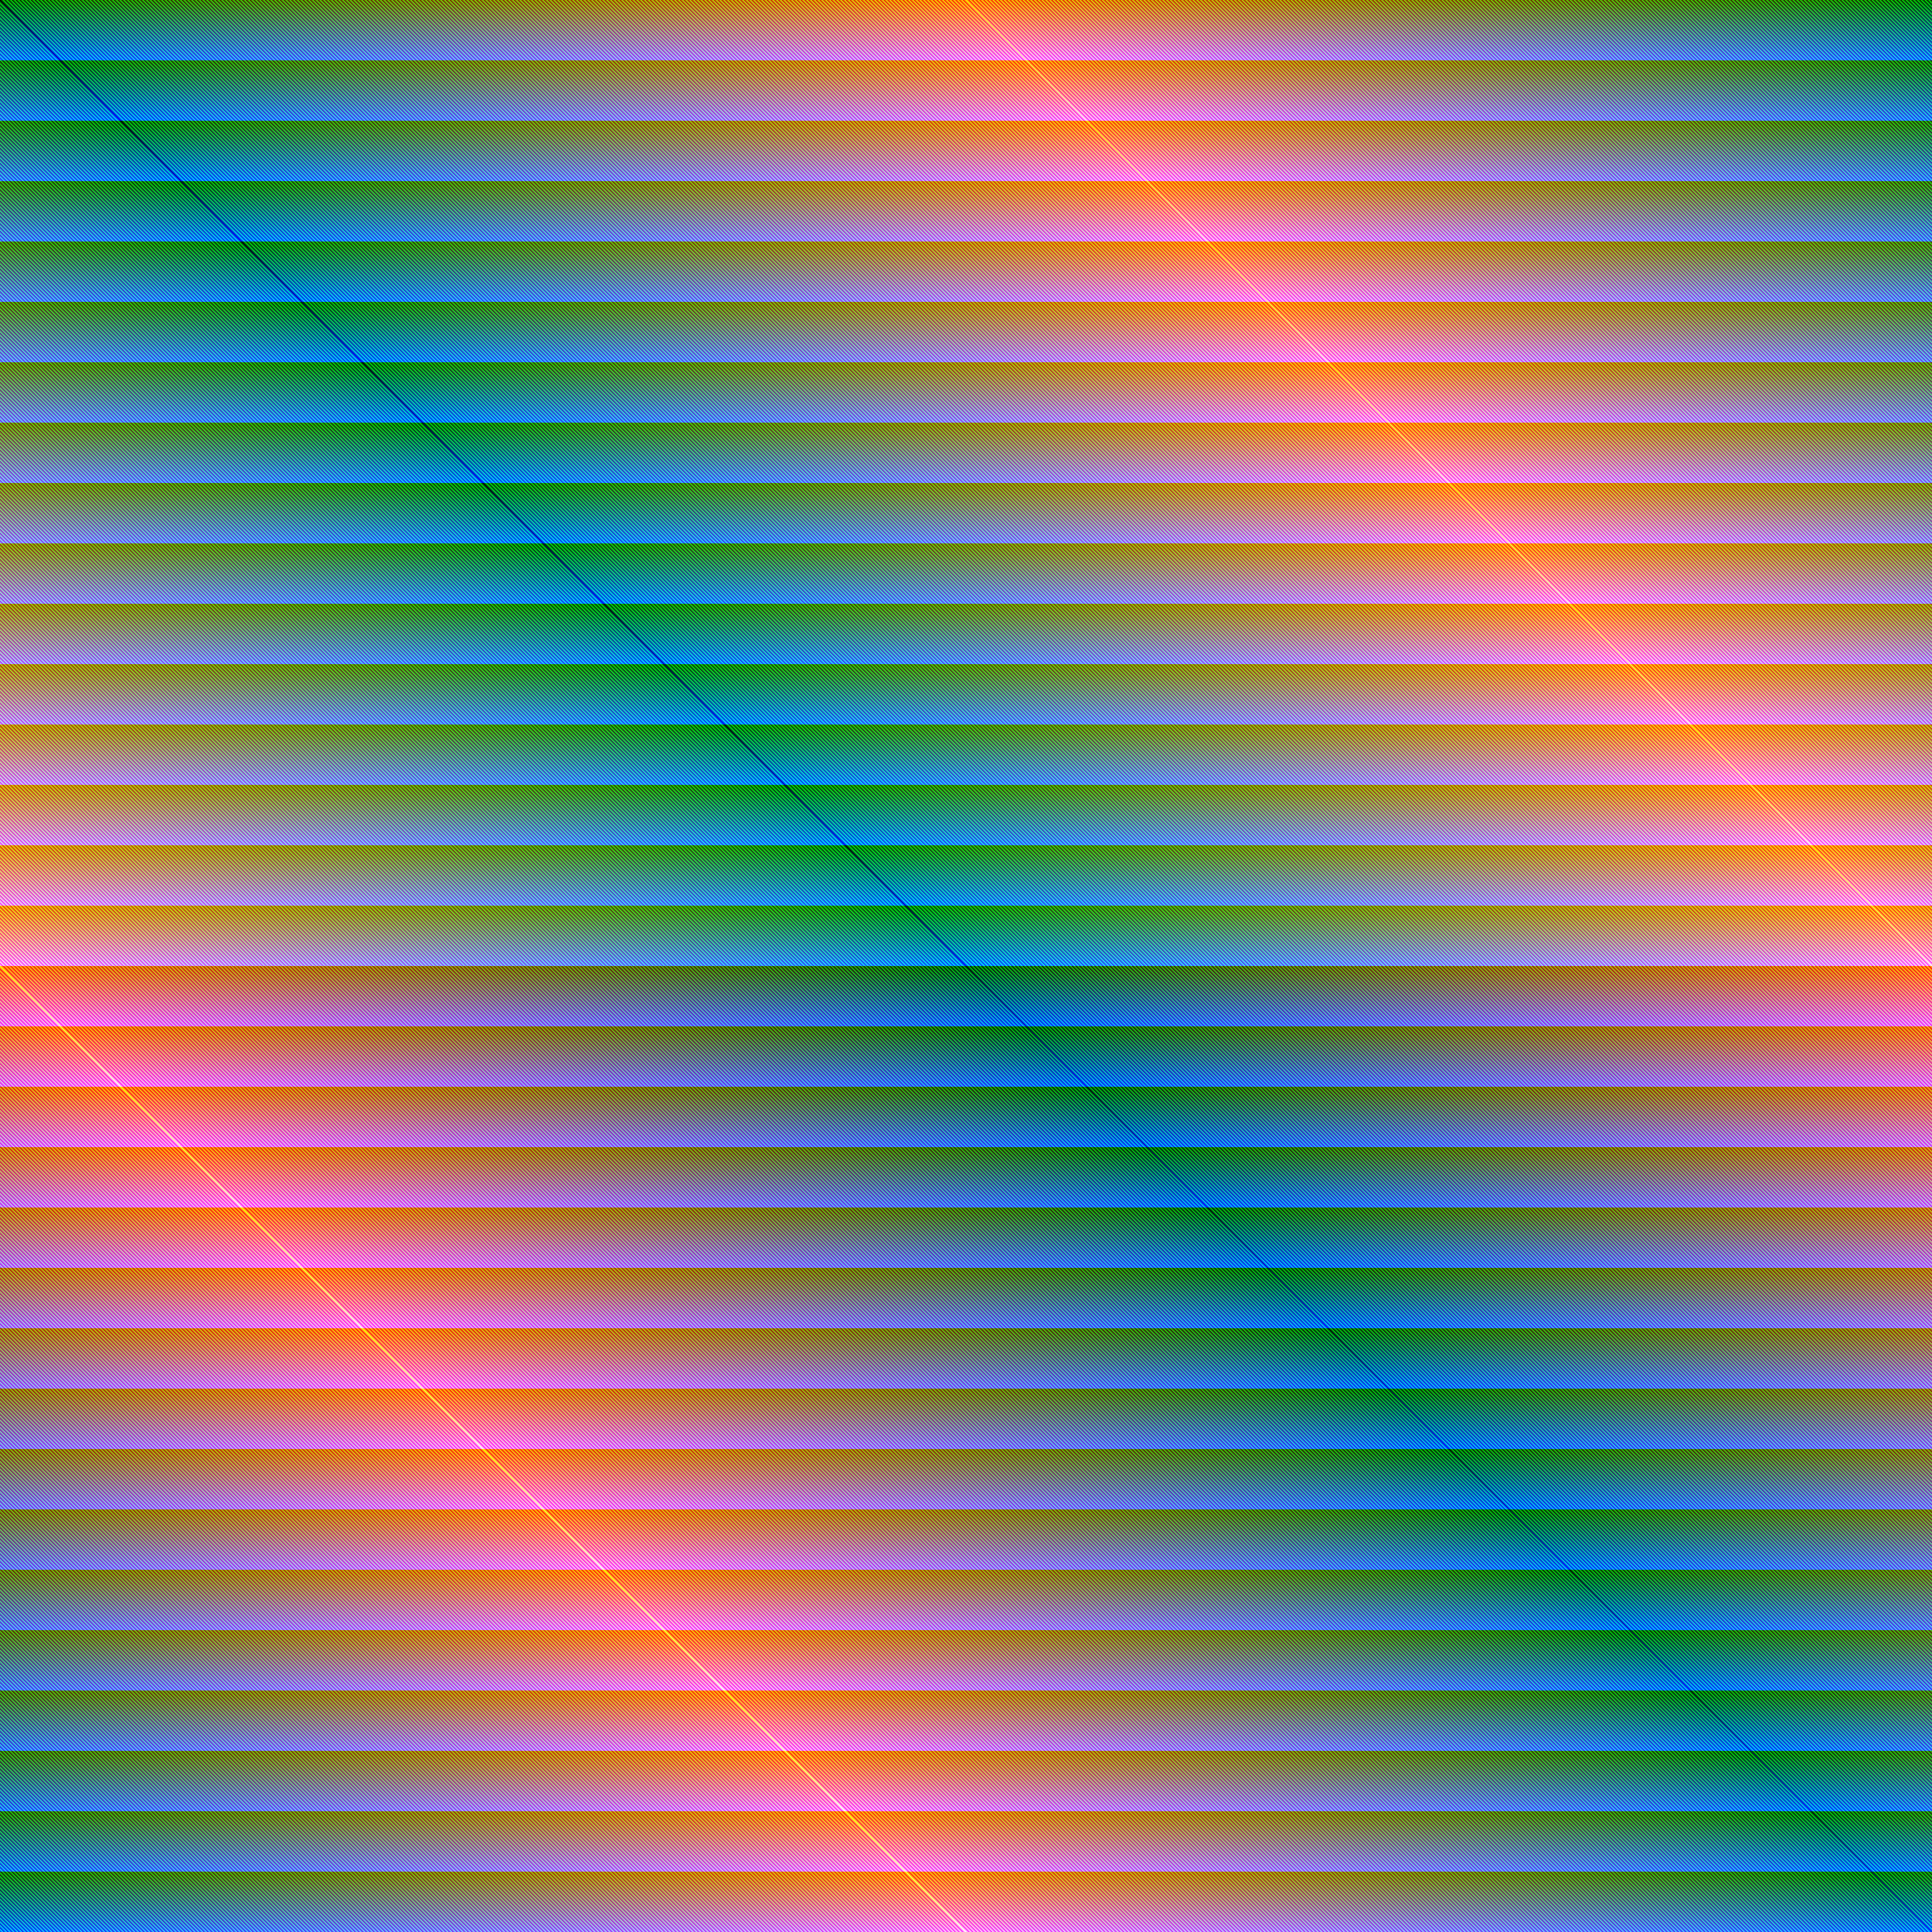


Prompt:
Can you analyze the following study:
On the visualization of large-order graph distance matrices
Can you then write Python code that generates a 4,096 by 4,096 pixel image that represents what they're describing in the study, but using all 24-bit RGB colors exactly once.
Rendered with Google Colab.
| Date | |
|---|---|
| Colors | 16,777,216 |
| Pixels | 16,777,216 |
| Dimensions | 4,096 × 4,096 |
| Bytes | 281,707 |
